Household Wealth
This is the first of a new series of quarterly reports on the wealth of Irish households. It compliments the statistical releases for Irish Quarterly Financial Accounts with more detail on household's assets and liabilities and a breakdown by wealth distribution.
Key Points – Q3 2024
Publication date: 28 February 2025
- The net wealth of Irish households reached €1,205.1bn at the end of the quarter, increasing by €56.2bn since Q2 2024.
- Total investment of €11.2bn was mainly driven by investment in new housing and in insurance and pensions entitlements during the quarter.
- The overall value of housing assets owned by Irish households increased by €32.8bn in the period.
- As of Q3 2024, the wealthiest 10 per cent of households held 49 per cent of total net wealth in the country.
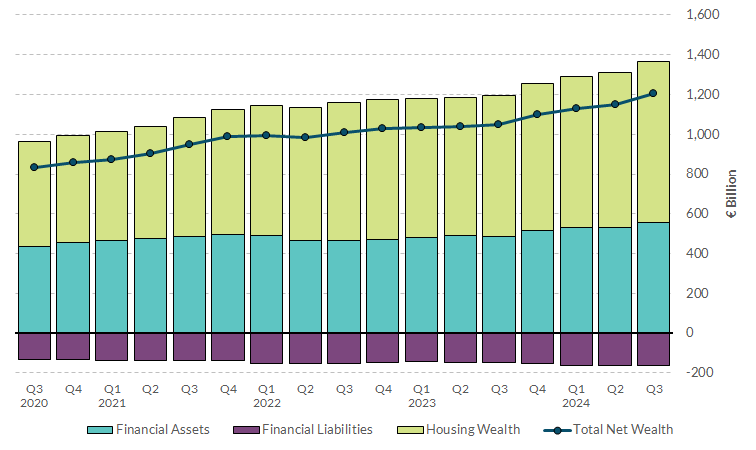
Chart 1 – Total net wealth of Irish households
View data for chart 1 (XLSX 20.34KB)
Total net wealth of Irish households rose by €56.2bn to stand at €1,205.1bn in Q3 2024. This represents a new series high, continuing the pattern of growth seen in recent years.
Total financial assets of the Irish household sector equalled €556.4bn, reflecting an increase of €23.8bn over the quarter. They were mainly composed of currency and deposits (€206.1bn) and insurance and pension entitlements (€259.7bn).
Total housing wealth increased by €32.8bn to reach €812.0bn. As of Q3 2024, housing assets represented 67 per cent of total net wealth and 59 per cent of total assets of Irish households.
Conversely, total liabilities, mainly consisting of long-term loans, amounted to €163.3bn. They remained largely unchanged when compared to the previous quarter.
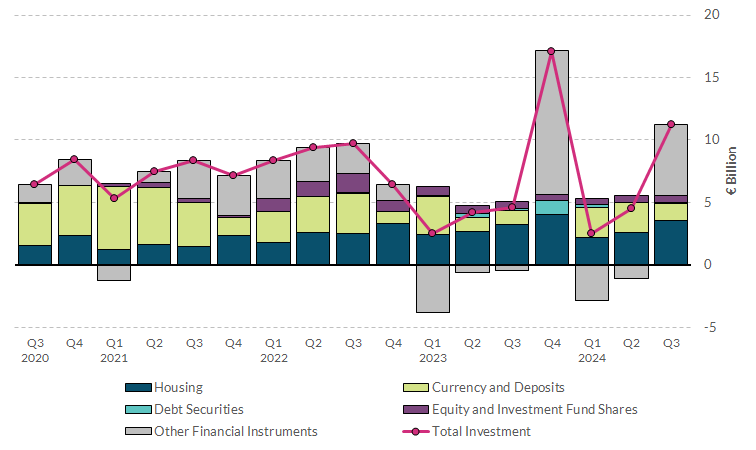
Chart 2 – Quarterly investment of Irish households, by instrument
View data for chart 2 (XLSX 14.26KB)
Positive revaluations for existing financial assets (€11.7bn) and existing housing (€29.3bn) were the main contributors to the increase in household net wealth in the quarter.
Households’ investments in new housing and financial assets totalled €11.2bn in Q3 2024. Investment in new housing equalled €3.5bn, broadly in line with previous quarters. New financial investments were primarily in deposits (€1.4bn) and in other financial items (€5.7bn), comprising life insurance policies and annuities (€3.3bn) and pension entitlements (€2.4bn).
In recent years, Irish households have generally displayed positive investment in housing and financial instruments, with the only significant exceptions being some divestments in insurance and pension entitlements in some quarters.
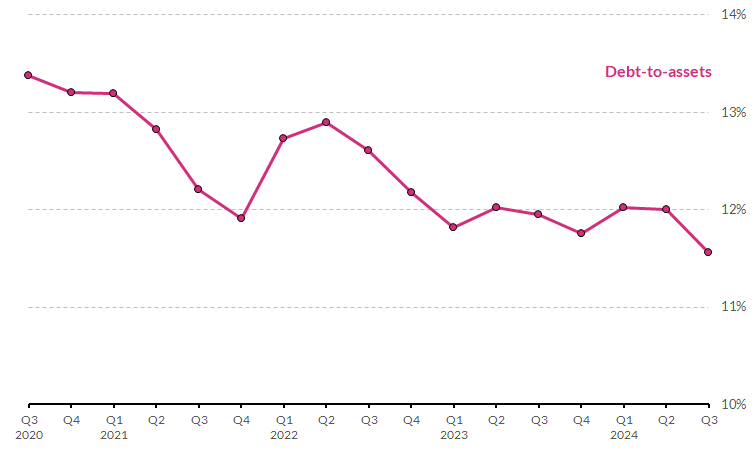
Chart 3 – Household leverage indicators
View data for chart 3 (XLSX 21.48KB)
Total household loans increased by €0.6bn over the quarter, totalling €158.1bn as of Q3 2024. However, since the relative growth of household debt was lower than the relative increase of total assets during the period (€56.6bn), the debt-to-assets ratio decreased to stand at 11.6 per cent.
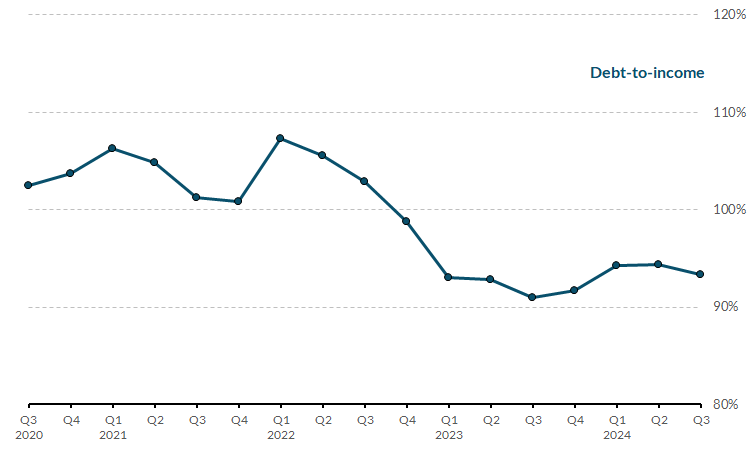
The debt-to-income ratio of Irish households also decreased to reach 93.3 per cent at the end of the quarter. Data from the Central Statistics Office (CSO) shows that household gross disposable income (on an annualised basis) equalled €169.4bn as of Q3 2024.
Chart 4 – Total net wealth of Irish households, by wealth
decile
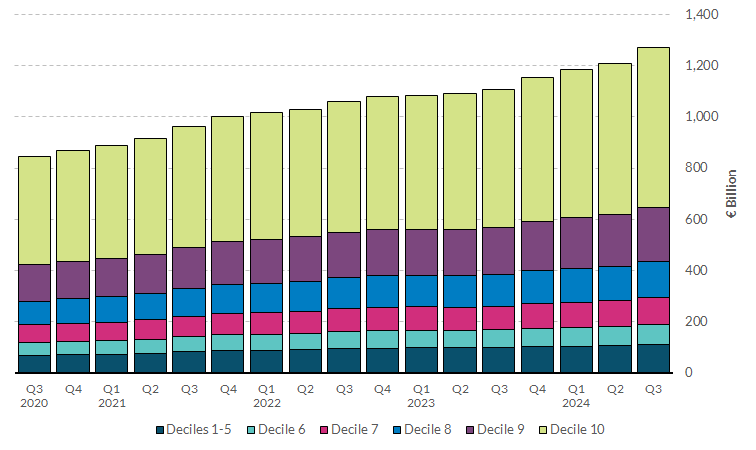
View data for Chart 4 (XLSX 31.24KB)
Distributional Wealth Accounts (DWA) data provide insights on the distribution of wealth across Irish households.
As of Q3 2024, the wealthiest 10 per cent of Irish households owned €627.5bn, or 49 per cent of total household net wealth in the country. This is more than five times the amount held by households in the bottom half of the net wealth distribution altogether (€109.9bn, or 9 per cent). Since the beginning of the series in 2013, however, the proportion of wealth held by the poorest half of households followed an upward trend, highlighting decreasing wealth inequality in the country.
As of Q3 2024, households in the “middle” part of the distribution (i.e., those in deciles 6 to 9) own €535.8bn overall, or 42 per cent of the total.
Compared to the previous quarter, total net wealth increased by €5.3bn (5 per cent) for households in the poorest half and by €35.5bn (6 per cent) for households in the richest decile. For both groups this increase was driven by growth in total assets over the course of the quarter.
Chart 5 – Balance sheet composition of Irish households, by wealth decile
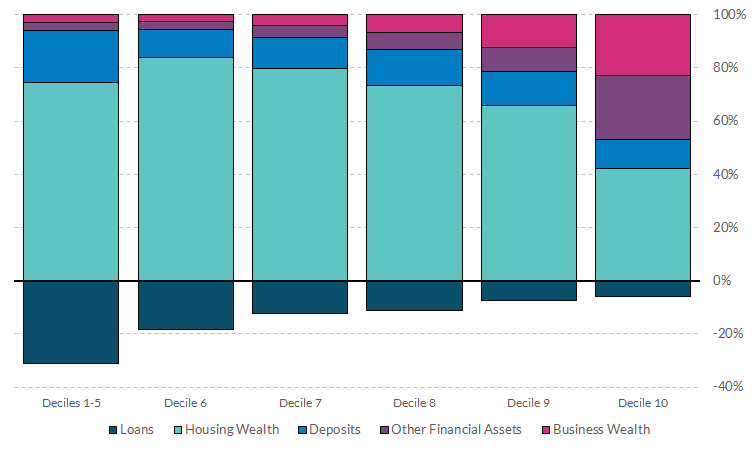
View data for chart 5 (XLSX 25.15KB)
The balance sheet composition of Irish households differs significantly between the wealthier and poorer.
Overall, as of Q3 2024, households in the top net wealth decile displayed a more diversified portfolio composition, where business wealth (i.e., equity in unlisted companies and non-residential non-financial assets) featured prominently (23 per cent of total assets). Compared to households in the bottom half of the wealth distribution, they also displayed lower leverage (6 per cent).
Conversely, poorer households held the largest part of their financial wealth in deposits (19 per cent of their total assets) and were significantly more leveraged (31 per cent).
For all household groups, housing assets represent the main component of their wealth.
The balance sheet composition of households in each wealth decile remained almost unchanged from the previous quarter. Since the beginning of the series, these proportions have been generally stable over time.
Chart 6 – Gini coefficient of wealth inequality
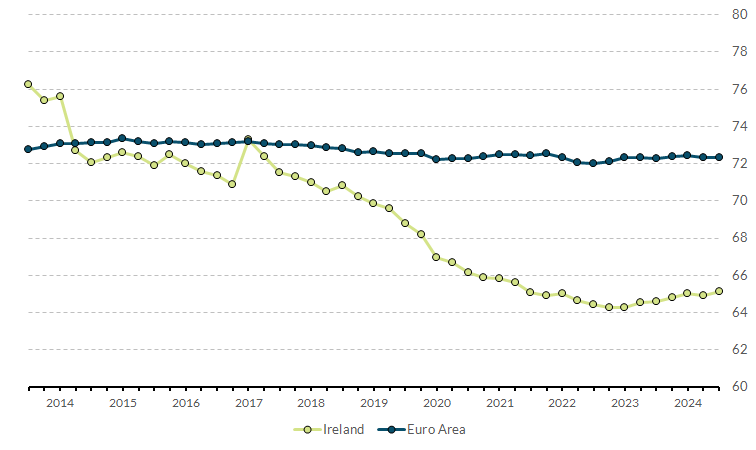
View data for chart 6 (XLSX 19.46KB)
As of Q3 2024, the Irish Gini coefficient (a widely used measurement of inequality) was 65.1, marginally increasing from the previous quarter.
This remained well below the overall index for the euro area (72.3) and of most other European countries, as it has been for the past few quarters. Moreover, since the beginning of the series, the Gini coefficient of Ireland decreased significantly (-11.2 points), indicating a notable reduction in the level of wealth inequality in the country.
As outlined above, the sustained de-leveraging process of poorer households and the rise in value of housing assets – which mainly benefited households for whom this asset represents a larger component of their total wealth (i.e., mid-lower deciles) – drove the increase in the share of total net wealth held by the poorest half of households. As a result, these movements drove the large decrease in inequality since the beginning of the series.
Documents
Household Wealth Report - 2024 Q3 | pdf 483 KB
Household Wealth Report - Glossary | pdf 424 KB
Household Wealth Report - Publication Notes | pdf 246 KB