Behind the Data

Who uses allowances under the Mortgage Measures Framework and has this changed during the COVID-19 crisis?
Authors Jane Kelly, Christina Kinghan and Derek Lambert*
June 2021
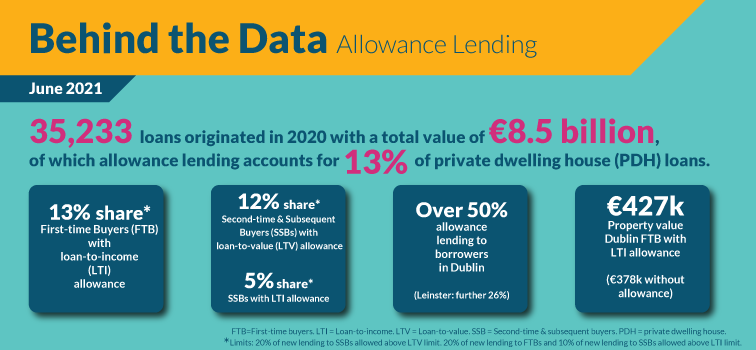
While the proportion of new lending with an allowance fell during the pandemic, the type of borrower who got an allowance loan has remained broadly similar and there has been no sign of a deterioration in borrower credit quality since the pandemic.
The Central Bank of Ireland mortgage measures are aimed at enhancing the resilience of both borrowers and the banking sector and have been an important part of the Irish macroprudential policy framework since their introduction in 2015. These borrower-based measures operate by limiting the loan-to-value (LTV) and loan-to-income (LTI) ratios applying to new residential mortgage lending. As part of the mortgage measures framework, a share of lending is permitted to exceed the LTV and LTI limits in each year. This lending above the limits allows banks flexibility in issuing higher LTV / LTI loans to certain borrowers who can demonstrate stronger repayment capacity. The allowances also avoid an overly prescriptive approach by the Central Bank, with the decision of whom to allocate allowances to, and the LTV and LTI applying to these loans, being made by the individual banks (Cassidy et al, 2016). The share of allowance lending permitted under the mortgage measures is determined as a proportion of each lender’s annual new mortgage lending issued in the calendar year, rather than a fixed amount.
This "Behind the Data" uses new data on mortgage lending in 2020 to examine how shares of lending with an allowance changed during the COVID-19 crisis. The onset of the pandemic saw an initial sharp fall in new mortgage lending followed by a marked recovery in late-2020 (Kelly et al., 2020). The characteristics of borrowers with an allowance in 2020 are compared to those in 2019 and new insights into the regional distribution of allowance lending are provided.
The Data
To monitor compliance with the mortgage measures, financial institutions are required to complete a six-monthly return, called the monitoring templates (MT), providing loan-level information for all loans covered by the measures. These detailed loan-level data are only required of lenders who advance at least €50 million of residential loans over a six-month reporting period. In 2020, a total of 35,233 loans were originated by seven lending institutions, with a value of €8.5 billion. These institutions were Allied Irish Banks (AIB, including the Educational Building Society (EBS) and Haven), Bank of Ireland (BoI), Permanent TSB (PTSB), Ulster Bank Ireland DAC (UBI), KBC Bank Ireland (KBC), Finance Ireland and Dilosk DAC. As part of the Central Bank’s commitment to transparency, summary data and commentary on new mortgage lending under the measures have been published since 2018.

This BTD examines new data on allowance lending for the purchase of a primary dwelling home (PDH) included in the mortgage measures data release. It provides an overview of a new monthly disaggregation of allowance lending, the overall shares of allowance lending over time and how that changed in 2020 and the regional distribution of allowance lending over time. To complement the national focus, we also use new data on the characteristics of Dublin borrowers with and without an allowance as they account for a significant share of allowance lending.
Lending with an allowance fell during the pandemic though the split of allowances between FTBs and SSBs remained similar
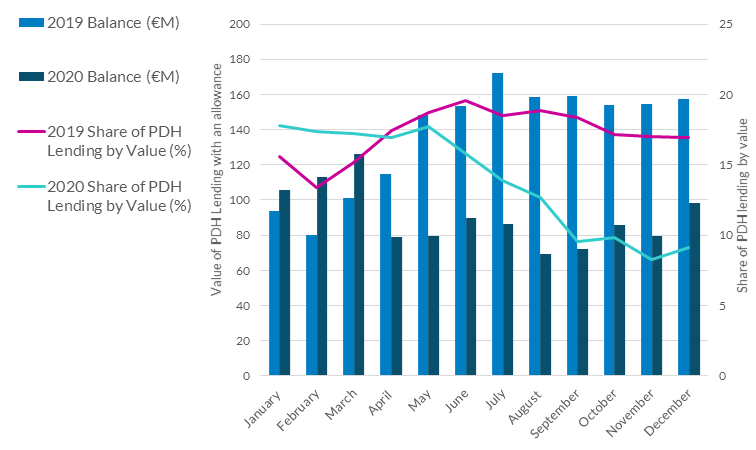
Allowance lending accounted for 17 per cent of total new PDH lending in 2018 and 2019. With the onset of COVID-19, this figure dropped to 13 per cent (Chart 1). For the first 3 months of 2020 the share was higher than in 2019. The impact of the pandemic on allowance lending is clearly seen from April 2020 onward, with an initial large drop in the value of lending with an allowance followed by some stabilisation. While overall PDH lending recovered in late 2020 (Kelly et al, 2020), the share of lending with an allowance did not see the same recovery and ranged from eight to ten per cent of new mortgages between September and December.
Chart 1: Value of PDH allowance lending and share of PDH lending with an allowance, 2019 and 2020

Source: Central Bank calculations using MT Data
Notes: In- Scope lending only. Small numbers of borrowers received both an LTV and LTI allowance
The allowances are limits and not targets and do not replace responsible lending standards and the application of suitability requirements by lenders. Lenders tend to lend between three to four percentage points lower than the maximum allowance share per calendar year. This gap seems to represent buffers to allow for the uncertainty around future demand and the translation of mortgage approvals into drawdowns. In 2020, this gap rose to seven percentage points for First Time Buyers (FTBs) with an LTI allowance, eight percentage points for Second and Subsequent Buyers (SSBs) with an LTV allowance and five percentage points for SSBs with an LTI allowance (Table 1). This increase in the buffer reflects lenders decisions to restrict the use of allowance lending in response to the initial Covid-19 shock likely due to factors such as the deterioration in the macroeconomic environment, banks’ credit policies and managing compliance with the shares of allowances permitted.(Financial Stability Review 2020:II)
FTB LTV allowances are rarely originated, even before the pandemic, with less than one per cent of the permitted five per cent of FTB lending above 90 per cent originated in both 2019 and 2020. The lower limit reflects the Central Bank’s view that lending above 90 per cent LTV should be undertaken only in exceptional circumstances (Central Bank of Ireland, 2016).
Notwithstanding the decline in the share of allowance lending after the pandemic onset, the relative distribution of allowances between FTBs and SSBs was fairly stable between 2019 and 2020 (Table 1).
Table 1: Shares of FTB and SSB lending with an allowance
|
% Value 2020 (Limit) |
% Value 2019 (Limit) |
% of overall allowances 2020 |
% of overall allowances 2019 |
| FTB Lending
|
59 |
57 |
|
|
| of which FTB over LTV Limit
|
0 (5) |
0 (5) |
0 |
0 |
| of which FTB over LTI Limit*
|
13 (20) |
17 (20) |
52 |
51 |
| SSB Lending
|
41 |
43 |
|
|
| of which SSB over the LTV Limit
|
12 (20) |
16 (20) |
32 |
36 |
| of which SSB over the LTI Limit*
|
5 (10) |
6 (10) |
15 |
14 |
Note: The % value refers to the total share of lending over each respective limit. The figure in brackets denotes the maximum share of allowance lending permitted under the mortgage measures. % of overall allowances refers to the share of total allowances.
Borrower characteristics remain broadly consistent since pandemic
The characteristics of those who availed of an allowance in 2020 remained broadly consistent with 2019.
The updated data for 2020 shows that both FTBs and SSBs with an LTI allowance were statistically more likely to be single applicants and purchasing in Dublin. They were two to four years younger on average and tended to use a broker rather than directly dealing with the lender. In terms of magnitudes, average loan sizes and property values among those with an LTI allowance in 2020 continued to increase relative to earlier years (for both FTBs and SSBs).
SSBs with an LTV allowance in 2020 (and 2019) were on average two years younger and were statistically more likely to have used a broker than borrowers without an allowance.
New data also shows that among FTBs purchasing a newly-constructed property a higher share used an allowance (13 per cent), compared to those purchasing a second-hand property (eight per cent). For SSBs, there was no difference in the share of borrowers with an allowance purchasing a newly-constructed or second-hand property (14 per cent).
Over half of all allowances are allocated to Dublin buyers
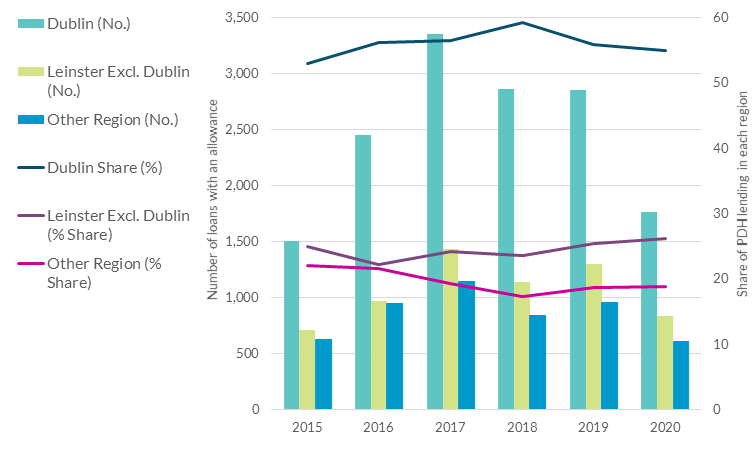
To complement that national data, new data is provided on the regional distribution of lending with an allowance (Chart 2). While around a third of new lending took place in Dublin, over 50 per cent of allowance lending originated to borrowers purchasing in Dublin. A further 26 per cent of allowance lending is originated in Leinster (excluding Dublin). These shares were relatively stable between 2019 and 2020.
Borrowers purchasing in Dublin consistently predominate across each borrower and allowance type. For FTBs with an LTI allowance, over 60 per cent were purchasing in Dublin in 2020, compared to 26 per cent among those without. Similar patterns are observed among SSBs.
Chart 2: Number and share of PDH lending with an allowance by region, 2015 - 2020

Source: Central Bank calculations using MT Data
Notes: In- Scope lending only. The share (%) refers to the share of total allowance lending that is located in each region. ‘Other’ region includes lending in Ulster, Connacht and Munster
Within Dublin, borrowers with an allowance differ to those without an allowance
Examining new data on the characteristics of borrowers with and without an allowance in Dublin, Table 2 shows that both FTBs and SSBs with an LTI allowance in Dublin have higher average loan sizes and property values but lower incomes than those without an allowance. These borrowers are also younger with longer loan terms and more likely to be single applicants. LTI allowances in Dublin therefore seem to be used to offer higher LTI loans to borrowers on lower average incomes to facilitate the purchase of more expensive properties. By contrast, SSBs with an LTV allowance in Dublin tend to have higher average incomes and higher loan sizes but purchase less expensive properties and are more likely to be joint applicants.
Table 2: Mean Characteristics of Dublin borrowers with and without an allowance, 2020
|
|
Without |
With |
Difference |
| FTB LTI Allowance |
Loan Size (€) |
298,921 |
353,628 |
54,707 |
| Property Value (€) |
378,796 |
427,257 |
48,460 |
| Income (€) |
96,974 |
87,573 |
-9,401 |
| Loan Term (Years) |
29 |
32 |
3 |
| Borrower Age (Years) |
35 |
33 |
-2 |
| Joint Applicant (%) |
73.1 |
67.9 |
-5.2 |
| SSB LTI Allowance |
Loan Size (€) |
362,899 |
442,403 |
79,504 |
| Property Value (€) |
563,559 |
638,713 |
75,154 |
| Income (€) |
136,837 |
110,510 |
-26,327 |
| Loan Term (Years) |
24 |
29 |
5 |
| Borrower Age (Years) |
42 |
38 |
-4 |
| Joint Applicant (%) |
79.0 |
70.3 |
-8.7 |
| SSB LTV Allowance |
Loan Size (€) |
357,927 |
445,957 |
88,030 |
| Property Value (€) |
577,934 |
506,929 |
-71,005 |
| Income (€) |
132,328 |
152,946 |
20,618 |
| Loan Term (Years) |
24 |
27 |
3 |
| Borrower Age (Years) |
42 |
40 |
-2 |
| Joint Applicant (%) |
77.1 |
87.1 |
10.0 |
Full tables available here. All differences are statistically significant at the 1% level
Conclusion
Allowance lending fell at the onset of the pandemic before stabilising at a lower level for the remainder of 2020. Nonetheless, the allocation of 2020 allowance lending was broadly unchanged from 2019, both between FTBs and SSBs and on a regional basis, with around three quarters of allowance lending to borrowers located in Dublin and Leinster. Within Dublin, borrowers with an LTI allowance borrowed larger loan amounts to purchase more expensive properties on lower average incomes, than those without an allowance, confirming no change from earlier findings (Kinghan et al., 2019). These characteristics were broadly consistent with 2019 however and do not point to any significant deterioration in borrower credit quality since the pandemic. The findings from this note help to provide an understanding of the functioning of allowances within the broader mortgage measures framework, including the period since the pandemic onset.
*Email [email protected] if you have any comments or questions on this note. Comments from Rory McElligott, Maria Woods, Niamh Hallissey, Fergal McCann, Caroline Mehigan, David Duignan and Paul Lyons are gratefully acknowledged. The views expressed in this note are those of the authors and do not necessarily reflect the views of the Central Bank of Ireland or the ESCB.
See also: